Wigner example
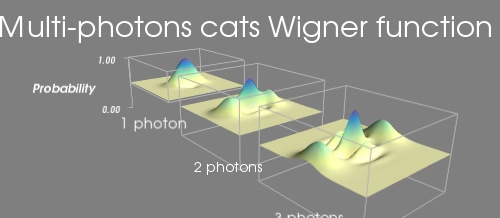
An example in which 3 functions of x and y are displayed with a surf plot, while the z scaling is kept constant, to allow comparison between them.
The important aspect of this example is that the 3 functions should not be displayed on top of each other, but side by side. For this we use the extent keyword argument.
In addition, the relative scale between the different plots is important. This is why we also use the warp_scale keyword argument, to have the same scale on all plots.
Finally, we have to adjust the data bounds: as we want the “horizon” of the wigner function in the middle of our extents, we put this to zero.
We add a set of axes and outlines to the plot. We have to play we extents and ranges in order to make them fit with the data.
Python source code: wigner.py
# Author: Gael Varoquaux <gael.varoquaux@normalesup.org>
# Copyright (c) 2007, Enthought, Inc.
# License: BSD Style.


import numpy
from mayavi import mlab


def cat(x, y, alpha, eta=1, purity=1):
    """ Multiphoton shrodinger cat. eta is the fidelity, alpha the number
        of photons"""
    cos = numpy.cos
    exp = numpy.exp
    return (1 + eta * (exp(-x ** 2 - (y - alpha) ** 2) + exp(-x ** 2 -
    (y + alpha) ** 2) + 2 * purity * exp(-x ** 2 - y ** 2) * cos(2 * \
    alpha * x)) / (2 * (1 + exp(- alpha ** 2)))) / 2

x, y = numpy.mgrid[-4:4.15:0.1, -4:4.15:0.1]

mlab.figure(1, size=(500, 250), fgcolor=(1, 1, 1),
                                    bgcolor=(0.5, 0.5, 0.5))
mlab.clf()

cat1 = cat(x, y, 1)
cat2 = cat(x, y, 2)
cat3 = cat(x, y, 3)

# The cats lie in a [0, 1] interval, with .5 being the assymptotique
# value. We want to reposition this value to 0, so as to put it in the
# center of our extents.
cat1 -= 0.5
cat2 -= 0.5
cat3 -= 0.5

cat1_extent = (-14, -6, -4, 4, 0, 5)
surf_cat1 = mlab.surf(x - 10, y, cat1, colormap='Spectral', warp_scale=5,
            extent=cat1_extent, vmin=-0.5, vmax=0.5)
mlab.outline(surf_cat1, color=(.7, .7, .7), extent=cat1_extent)
mlab.axes(surf_cat1, color=(.7, .7, .7), extent=cat1_extent,
            ranges=(0, 1, 0, 1, 0, 1), xlabel='', ylabel='',
            zlabel='Probability',
            x_axis_visibility=False, z_axis_visibility=False)

mlab.text(-18, -4, '1 photon', z=-4, width=0.13)

cat2_extent = (-4, 4, -4, 4, 0, 5)
surf_cat2 = mlab.surf(x, y, cat2, colormap='Spectral', warp_scale=5,
            extent=cat2_extent, vmin=-0.5, vmax=0.5)
mlab.outline(surf_cat2, color=(0.7, .7, .7), extent=cat2_extent)

mlab.text(-4, -3, '2 photons', z=-4, width=0.14)

cat3_extent = (6, 14, -4, 4, 0, 5)
surf_cat3 = mlab.surf(x + 10, y, cat3, colormap='Spectral', warp_scale=5,
            extent=cat3_extent, vmin=-0.5, vmax=0.5)
mlab.outline(surf_cat3, color=(.7, .7, .7), extent=cat3_extent)

mlab.text(6, -2.5, '3 photons', z=-4, width=0.14)

mlab.title('Multi-photons cats Wigner function')

mlab.view(142, -72, 32)

mlab.show()