Chemistry example
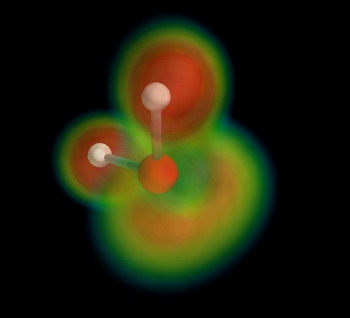
In this example, we display the H2O molecule, and use volume rendering to display the electron localization function.
The atoms and the bounds are displayed using mlab.points3d and mlab.plot3d, with scalar information to control the color.
The electron localization function is displayed using volume rendering. Good use of the vmin and vmax argument to mlab.pipeline.volume is critical to achieve a good visualization: the vmin threshold should placed high-enough for features to stand out.
The original is an electron localization function from Axel Kohlmeyer.

Python source code: chemistry.py
# Author: Gael Varoquaux <gael.varoquaux@normalesup.org>
# Copyright (c) 2008-2020, Enthought, Inc.
# License: BSD Style.

# Retrieve the electron localization data for H2O #############################
import os
if not os.path.exists('h2o-elf.cube'):
    # Download the data
    try:
        from urllib import urlopen
    except ImportError:
        from urllib.request import urlopen
    print('Downloading data, please wait')
    opener = urlopen(
        'http://code.enthought.com/projects/mayavi/data/h2o-elf.cube'
        )
    open('h2o-elf.cube', 'wb').write(opener.read())


# Plot the atoms and the bonds ################################################
import numpy as np
from mayavi import mlab
mlab.figure(1, bgcolor=(0, 0, 0), size=(350, 350))
mlab.clf()

# The position of the atoms
atoms_x = np.array([2.9, 2.9, 3.8]) * 40 / 5.5
atoms_y = np.array([3.0, 3.0, 3.0]) * 40 / 5.5
atoms_z = np.array([3.8, 2.9, 2.7]) * 40 / 5.5

O = mlab.points3d(atoms_x[1:-1], atoms_y[1:-1], atoms_z[1:-1],
                  scale_factor=3,
                  resolution=20,
                  color=(1, 0, 0),
                  scale_mode='none')

H1 = mlab.points3d(atoms_x[:1], atoms_y[:1], atoms_z[:1],
                   scale_factor=2,
                   resolution=20,
                   color=(1, 1, 1),
                   scale_mode='none')

H2 = mlab.points3d(atoms_x[-1:], atoms_y[-1:], atoms_z[-1:],
                   scale_factor=2,
                   resolution=20,
                   color=(1, 1, 1),
                   scale_mode='none')

# The bounds between the atoms, we use the scalar information to give
# color
mlab.plot3d(atoms_x, atoms_y, atoms_z, [1, 2, 1],
            tube_radius=0.4, colormap='Reds')

# Display the electron localization function ##################################

# Load the data, we need to remove the first 8 lines and the '\n'
str = ' '.join(file('h2o-elf.cube').readlines()[9:])
data = np.fromstring(str, sep=' ')
data.shape = (40, 40, 40)

source = mlab.pipeline.scalar_field(data)
min = data.min()
max = data.max()
vol = mlab.pipeline.volume(source, vmin=min + 0.65 * (max - min),
                                   vmax=min + 0.9 * (max - min))

mlab.view(132, 54, 45, [21, 20, 21.5])

mlab.show()
