Kiva
Kiva is a 2D vector drawing interface providing functionality similar to Quartz, Cairo, the Qt QPainter interface, the 2D drawing routines of OpenGL , the HTML5 Canvas element and many other similar 2D vector drawing APIs. Rather than re-implementing everything, Kiva is a Python interface layer that sits on top of many different back-ends, some of which are in fact provided by some of these libraries. Which back-ends are available depends on the platform, GUI toolkit, and capabilities of the system. For example the Quartz backend is only available on Mac OS systems, while the QPainter backend is available if PyQt or PySide are installed in the current Python environment.
This approach permits code to be written to the Kiva API, but produce output that could be rendered to a GUI window, an image file, a PDF file, or a number of other possible output formats without any (or at least minimal) changes to the image generation code.
Kiva is the base drawing layer of the Chaco plotting library, and is what is responsible for actually drawing pixels on the screen. Developers interested in writing code that renders new plots or other graphical features for Chaco will need to be at least passingly familiar with the Kiva drawing API.
The most important Kiva backend is the Agg or “Image” backend, which is a Python extension module which wraps the C++ Anti-grain geometry drawing library into a Python extension and exposes the Kiva API. Agg renders the vector drawing commands into a raster image which can then be saved as a standard image format (such as PNG or JPEG) or copied into a GUI window. The Agg backend should be available on any platform, and should work even if there is no GUI or windowing system available.
Kiva Concepts
This section gives a whirlwind tour of the concepts involved with drawing with Kiva.
The Graphics Context
The heart of the Kiva drawing API is the “graphics context”, frequently
abbreviated as gc in code. The graphics context holds the current drawing
state (such as pen and fill colors, font state, and affine transformations to
be applied to points) and provides methods for changing the state and
performing drawing actions.
In many common use-cases (such as writing renderers for Chaco), you will be provided a graphics context by other code, but it is straight-forward to create your own graphics context:
from kiva.image import GraphicsContext

gc = GraphicsContext((400, 400))
This is an graphics context for the Agg or “image” backend which has a size of
400x400 pixels. If instead we wanted to draw into a Qt QPainter drawing
context in a QWidget called my_qwidget we would use:
from kiva.qpainter import GraphicsContext

gc = GraphicsContext((400, 400), parent=my_qwidget)
Other Kiva backends have similar methods of creating a graphics context, and each may take somewhat different arguments to the constructor, depending on the requirements of the backend.
Once you have a graphics context, you can use it to draw vector graphics. For example, the following code will draw a translucent gray line from (100, 100) to (100, 200):
gc.move_to(100, 100)
gc.line_to(100, 200)
gc.set_stroke_color((0.5, 0.5, 0.5, 0.5))
gc.stroke_path()
For many of the backends, you can save the rendered image out as an image file
using the save() method:
gc.save("my_line.png")
Kiva is numpy-aware, and has a number of methods that allow you to pass numpy arrays of points to draw many things in one operation, with loops being performed in C where possible:
from numpy import empty, linspace, random

# Nx2 array of points
pts = empty(shape=(20, 2), dtype=float)
pts[:, 0] = linspace(100, 200, 20)
pts[:, 1] = random.uniform(size=20)*100 + 100

gc.lines(pts)
gc.stroke_path()
Coordinate Model
Kiva uses mathematical axes direction conventions as opposed to framebuffer axes conventions. In other words, the origin is always at the bottom left of the screen, and the positive y axis goes up from bottom to top; as opposed to screen coordinates which typically have the origin at the top left and the positive y axis goes down from top to bottom.
Additionally, for backends that produce raster images, the coordinates represent the corner of pixels, rather than the center of pixels. This has consequences when rendering thin lines. Compare the two lines in this example, for instance:
from kiva.image import GraphicsContext

gc = GraphicsContext((200, 100))

gc.move_to(40, 35)
gc.line_to(160, 35)

gc.move_to(40, 65.5)
gc.line_to(160, 65.5)

gc.set_stroke_color((0.0, 0.0, 0.0))
gc.stroke_path()

gc.save("pixel_coordinates.png")
Notice that the line on the bottom (the first of the two lines) is fuzzier because it is drawn along the boundary of the pixels, while the other line is drawn through the center of the pixels:
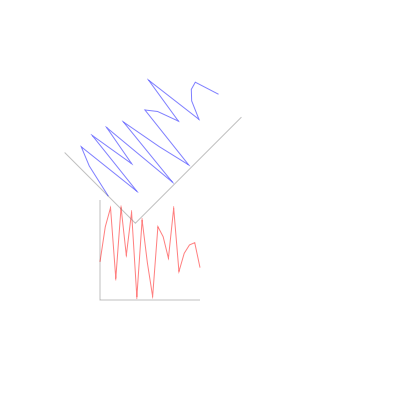
The Coordinate Transform Matrix
The Kiva API allows arbitrary affine transforms to be applied to the graphics context during drawing. The API provides convenience methods for common transformations, such as rotation and scaling:
from numpy import empty, linspace, random, pi
from kiva.image import GraphicsContext

# Nx2 array of points
pts = empty(shape=(20, 2), dtype=float)
pts[:, 0] = linspace(100, 200, 20)
pts[:, 1] = random.uniform(size=20)*100 + 100

gc = GraphicsContext((400, 400))

# draw a simple graph
gc.move_to(100, 200)
gc.line_to(100, 100)
gc.line_to(200, 100)
gc.set_stroke_color((0.5, 0.5, 0.5, 0.5))
gc.stroke_path()

gc.lines(pts)
gc.set_stroke_color((1.0, 0.0, 0.0, 0.5))
gc.stroke_path()

# translate by 100 pixels in the x direction
gc.translate_ctm(100, 0)

# rotate by 45 degrees
gc.rotate_ctm(pi/4.0)

# scale by 1.5 in the x direction
gc.scale_ctm(1.5, 1.0)

# now draw in the transformed coordinates
gc.move_to(100, 200)
gc.line_to(100, 100)
gc.line_to(200, 100)
gc.set_stroke_color((0.5, 0.5, 0.5, 0.5))
gc.stroke_path()

gc.lines(pts)
gc.set_stroke_color((0.0, 0.0, 1.0, 0.5))
gc.stroke_path()

gc.save('transformed_lines.png')
If desired, the user can also supply their own transformations directly.
Paths
The basic drawing operations are performed by building a path out of primitive operations, and then performing stroking and/or filling operations with it.
The simplest path operations are move_to()
and line_to() which respectively move the
current point in the path to the specified point, and add a line to the path
from the current point to the specified point.
In addition to the straight line commands, there are 4 arc commands for adding
curves to a path: curve_to() which draws a
cubic bezier curve, quad_curve_to() which
draws a quadratic bezier curve, arc() which
draws a circular arc based on a center and radius, and
arc_to() which draws a circular arc from one
point to another.
Finally, the rect() method adds a rectangle
to the path.
In addition there are convenience methods
lines(),
rects() and
line_set() which add multiple lines or
rectangles to a path, reading from appropriately shaped NumPy arrays.
None of these methods make any change to the visible image until the path is
drawn with draw_path() or the convenience
methods stroke_path(),
fill_path(), or
eof_fill_path(). The way
these actions are performed depends upon the state of the graphics context.
For stroking, the graphics context keeps track of the color to use with
set_stroke_color(), the thickness of the
line with set_line_width(),
the way that lines are joined with
set_line_join() and
set_miter_limit(), and the way that they are
ended with set_line_cap().
Lines can also be dashed using the
set_line_dash() method which takes a
pattern of numbers to use for lengths of on and off, and an optional phase
for where to start in the pattern.
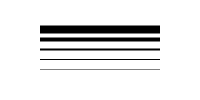
Thicknesses:
from kiva.image import GraphicsContext

gc = GraphicsContext((200, 100))

for i in range(5):
    y = 30.5 + i*10
    thickness = 2.0**(i-1)

    gc.move_to(40, y)
    gc.line_to(160, y)
    gc.set_line_width(thickness)
    gc.stroke_path()

gc.save('thicknesses.png')
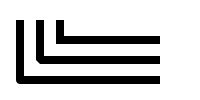
Joins:
from kiva.api import JOIN_ROUND, JOIN_BEVEL, JOIN_MITER
from kiva.image import GraphicsContext

gc = GraphicsContext((200, 100))
gc.set_line_width(8)

for i, join in enumerate([JOIN_ROUND, JOIN_BEVEL, JOIN_MITER]):
    y = 20 + i*20

    gc.move_to(y, 80)
    gc.line_to(y, y)
    gc.line_to(160, y)
    gc.set_line_join(join)
    gc.stroke_path()

gc.save('joins.png')
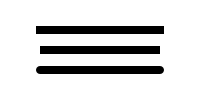
Caps:
from kiva.api import CAP_ROUND, CAP_BUTT, CAP_SQUARE
from kiva.image import GraphicsContext

gc = GraphicsContext((200, 100))
gc.set_line_width(8)

for i, cap in enumerate([CAP_ROUND, CAP_BUTT, CAP_SQUARE]):
    y = 30 + i*20

    gc.move_to(40, y)
    gc.line_to(160, y)
    gc.set_line_cap(cap)
    gc.stroke_path()

gc.save('caps.png')
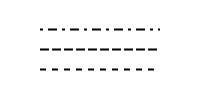
Dashes:
from kiva.image import GraphicsContext

gc = GraphicsContext((200, 100))
dashes = ([6.0, 6.0], [9.0, 3.0], [3.0, 5.0, 9.0, 5.0])
gc.set_line_width(2)

for i, dash in enumerate(dashes):
    y = 30.5 + i*20

    gc.move_to(40, y)
    gc.line_to(160, y)
    gc.set_line_dash(dash)
    gc.stroke_path()

gc.save('dashes.png')
Before filling a path, the color of the fill is via the
set_fill_color() method, and gradient fills
can be done via the set_linear_gradient()
and set_radial_gradient() methods. Finally,
there are two different fill modes available:
even-odd fill and
non-zero winding fill
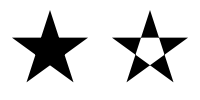
Winding vs. Even-Odd Fill:
from numpy import pi
from kiva.api import FILL, EOF_FILL
from kiva.image import GraphicsContext

gc = GraphicsContext((200, 100))
gc.set_fill_color((0.0, 0.0, 0.0))

gc.move_to(50, 90)
for i in range(1, 6):
    theta = 4*pi/5*i
    x = 50+40*sin(theta)
    y = 50+40*cos(theta)
    gc.line_to(x, y)

gc.fill_path()


gc.move_to(150, 90)
for i in range(1, 6):
    theta = 4*pi/5*i
    x = 150+40*sin(theta)
    y = 50+40*cos(theta)
    gc.line_to(x, y)

gc.eof_fill_path()

gc.save('fill.png')
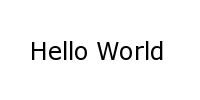
Text
Text can be rendered at a point by first setting the font to use, then setting
the text location using AbstractGraphicsContextset_text_position()
and then show_text() to
render the text:
from kiva.api import Font
from kiva.image import GraphicsContext

gc = GraphicsContext((200, 100))

gc.set_font(Font(size=24))
gc.set_text_position(30, 40)
gc.show_text("Hello World")

gc.save('text.png')
Text defaults to being rendered filled, but can be rendered with an outline.
Images
Raster images from NumPy arrays, Pillow Image objects, or some Kiva
graphics contexts can be rendered into a graphics context using the
draw_image() method.
Kiva Backends
The Kiva package comes with a number of backends included.
GUI-capable
Each of these backends can be used to draw the contents of windows in a graphical user interface.
- kiva.agg/image/oldagg
This is a wrapper of the popular Anti-Grain Geometry C++ library. It is the current default backend. This backend will be replaced by the celiagg backend in a future release.
- cairo
A backend based on the Cairo graphics library.
- celiagg
A newer wrapper of Anti-Grain Geometry which is maintained outside of kiva/enable. It is planned that this will become the default image backend in a future release.
- gl
OpenGL drawing. This backend is quite limited compared to others.
- qpainter
Qt
QPainterdrawing. This is only availble with the Qt toolkit.- quartz
MacOS Quartz graphics (ie CGContext). This is only available on macOS.
- blend2d
An experimental backend using the Blend2D Python wrapper.
File-only
Each of these backends can be used to create an output file.
A backend which writes PDF files.
- ps
A backend which writes PostScript files.
- svg
A backend which writes SVG files.