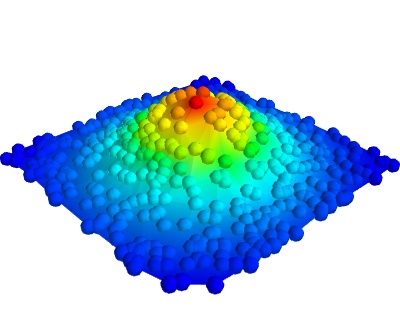
Surface from irregular data example
An example which shows how to plot a surface from data acquired irregularly.
Data giving the variation of a parameter ‘z’ as a function of two others (‘x’ and ‘y’) is often plotted as a carpet plot, using a surface to visualize the underlying function. when the data has been acquired on a regular grid for parameters ‘x’ and ‘y’, it can simply be view with the mlab.surf function. However, when there are some missing points, or the data has been acquired at random, the surf function cannot be used.
The difficulty stems from the fact that points positioned in 3D do not define a surface if no connectivity information is given. With the surf function, this information is implicit from the shape of the input arrays.
In this example, randomly-positioned points in the (x, y) plane are embedded in a surface in the z axis. We first visualize the points using mlab.points3d. We then use the delaunay2d filter to extract the mesh by nearest-neighboor matching, and visualize it using the surface module.

Python source code: surface_from_irregular_data.py
# Author: Gael Varoquaux <gael.varoquaux@normalesup.org>
# Copyright (c) 2009, Enthought, Inc.
# License: BSD Style.

import numpy as np

# Create data with x and y random in the [-2, 2] segment, and z a
# Gaussian function of x and y.
np.random.seed(12345)
x = 4 * (np.random.random(500) - 0.5)
y = 4 * (np.random.random(500) - 0.5)


def f(x, y):
    return np.exp(-(x ** 2 + y ** 2))

z = f(x, y)

from mayavi import mlab
mlab.figure(1, fgcolor=(0, 0, 0), bgcolor=(1, 1, 1))

# Visualize the points
pts = mlab.points3d(x, y, z, z, scale_mode='none', scale_factor=0.2)

# Create and visualize the mesh
mesh = mlab.pipeline.delaunay2d(pts)
surf = mlab.pipeline.surface(mesh)

mlab.view(47, 57, 8.2, (0.1, 0.15, 0.14))
mlab.show()
