Custom colormap example
An example showing how a custom colormap (or look up table) can be used for a given object.
Although the end user specifies colormaps by giving the name of a set of predefined colormaps, Mayavi (and VTK) deal with color internally using ‘Look Up Tables’ (LUT): a table that associate a scalar value to a color defined by its RGBA components.
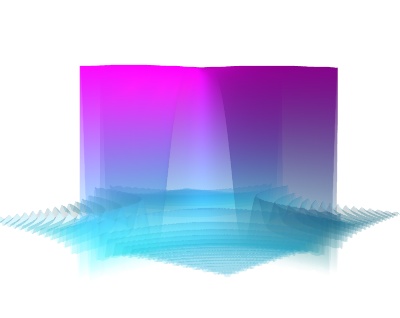
In this example, we show how the LUT of an object can be retrieved and modified. Specifically, we start by giving a surf object the ‘cool’ colormap, but we modify add to add a transparency effect.
Notice in the resulting image how the surface becomes more transparent for its lower points.
Note that if you want to use a different number of colors, you can change the ‘number_of_colors’ attribute of the lut object and assign a new array of the right shape to its ‘table’ attribute.
Python source code: custom_colormap.py
# Create some data
import numpy as np

x, y = np.mgrid[-10:10:200j, -10:10:200j]
z = 100 * np.sin(x * y) / (x * y)

# Visualize it with mlab.surf
from mayavi import mlab
mlab.figure(bgcolor=(1, 1, 1))
surf = mlab.surf(z, colormap='cool')

# Retrieve the LUT of the surf object.
lut = surf.module_manager.scalar_lut_manager.lut.table.to_array()

# The lut is a 255x4 array, with the columns representing RGBA
# (red, green, blue, alpha) coded with integers going from 0 to 255.

# We modify the alpha channel to add a transparency gradient
lut[:, -1] = np.linspace(0, 255, 256)
# and finally we put this LUT back in the surface object. We could have
# added any 255*4 array rather than modifying an existing LUT.
surf.module_manager.scalar_lut_manager.lut.table = lut

# We need to force update of the figure now that we have changed the LUT.
mlab.draw()
mlab.view(40, 85)

mlab.show()