Simple structured grid example
An example creating a structured grid data set from numpy arrays using TVTK and visualizing it using mlab.
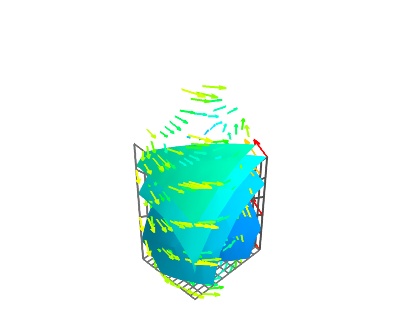
In this example, we create a structured-grid data set: we describe data, both scalar and vector, lying on a structured-grid, ie a grid where each vertex has 6 neighbors. For this we directly create a StructuredGrid tvtk object, rather than using the mlab.pipeline source functions, as it gives us more control.
To visualize the resulting dataset, we apply several modules, using the mlab.pipeline interface (see Assembling pipelines with mlab)
Python source code: simple_structured_grid.py
# Author: Prabhu Ramachandran <prabhu@aero.iitb.ac.in>
# Copyright (c) 2008, Prabhu Ramachandran.
# License: BSD Style.

from numpy import mgrid, empty, sin, pi
from tvtk.api import tvtk
from mayavi import mlab

# Generate some points.
x, y, z = mgrid[1:6:11j, 0:4:13j, 0:3:6j]
base = x[..., 0] + y[..., 0]
# Some interesting z values.
for i in range(z.shape[2]):
    z[..., i] = base * 0.25 * i

# The actual points.
pts = empty(z.shape + (3,), dtype=float)
pts[..., 0] = x
pts[..., 1] = y
pts[..., 2] = z

# Simple scalars.
scalars = x * x + y * y + z * z
# Some vectors
vectors = empty(z.shape + (3,), dtype=float)
vectors[..., 0] = (4 - y * 2)
vectors[..., 1] = (x * 3 - 12)
vectors[..., 2] = sin(z * pi)

# We reorder the points, scalars and vectors so this is as per VTK's
# requirement of x first, y next and z last.
pts = pts.transpose(2, 1, 0, 3).copy()
pts.shape = pts.size / 3, 3
scalars = scalars.T.copy()
vectors = vectors.transpose(2, 1, 0, 3).copy()
vectors.shape = vectors.size / 3, 3

# Create the dataset.
sg = tvtk.StructuredGrid(dimensions=x.shape, points=pts)
sg.point_data.scalars = scalars.ravel()
sg.point_data.scalars.name = 'temperature'
sg.point_data.vectors = vectors
sg.point_data.vectors.name = 'velocity'

# Thats it!

# Now visualize the data.
d = mlab.pipeline.add_dataset(sg)
gx = mlab.pipeline.grid_plane(d)
gy = mlab.pipeline.grid_plane(d)
gy.grid_plane.axis = 'y'
gz = mlab.pipeline.grid_plane(d)
gz.grid_plane.axis = 'z'
iso = mlab.pipeline.iso_surface(d)
iso.contour.maximum_contour = 75.0
vec = mlab.pipeline.vectors(d)
vec.glyph.mask_input_points = True
vec.glyph.glyph.scale_factor = 1.5

mlab.show()