Plotting many lines example
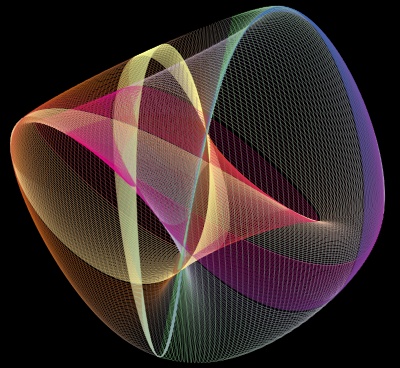
This examples shows how many lines can be grouped together in a single object, for convenience and efficiency.
We want to plot a large number of lines. We could use mlab.plot3d for this, but it will create an object for each line, this will be inefficient. This example shows how to create one object comprised of many lines.
The underlying idea is the same as that used to plot graphs (see for instance Flight graph example): create a set of points, and specify explicitly the connectivity between them. First we create the set of unconnected point (the underlying data structure is a PolyData) using mlab.pipeline.scalar_scatter. To add the connections, we need to keep track of which point is connected to which. As we only have lines, this is fairly easy: in a line, each point is connected to the following one.
Python source code: plotting_many_lines.py
# Author: Gael Varoquaux <gael dot varoquaux at normalesup dot org>
# Copyright (c) 2010, Enthought
# License: BSD style

import numpy as np

# The number of points per line
N = 300

# The scalar parameter for each line
t = np.linspace(-2 * np.pi, 2 * np.pi, N)

from mayavi import mlab
mlab.figure(1, size=(400, 400), bgcolor=(0, 0, 0))
mlab.clf()

# We create a list of positions and connections, each describing a line.
# We will collapse them in one array before plotting.
x = list()
y = list()
z = list()
s = list()
connections = list()

# The index of the current point in the total amount of points
index = 0

# Create each line one after the other in a loop
for i in range(50):
    x.append(np.sin(t))
    y.append(np.cos((2 + .02 * i) * t))
    z.append(np.cos((3 + .02 * i) * t))
    s.append(t)
    # This is the tricky part: in a line, each point is connected
    # to the one following it. We have to express this with the indices
    # of the final set of points once all lines have been combined
    # together, this is why we need to keep track of the total number of
    # points already created (index)
    connections.append(np.vstack(
                       [np.arange(index,   index + N - 1.5),
                        np.arange(index + 1, index + N - .5)]
                            ).T)
    index += N

# Now collapse all positions, scalars and connections in big arrays
x = np.hstack(x)
y = np.hstack(y)
z = np.hstack(z)
s = np.hstack(s)
connections = np.vstack(connections)

# Create the points
src = mlab.pipeline.scalar_scatter(x, y, z, s)

# Connect them
src.mlab_source.dataset.lines = connections
src.update()

# The stripper filter cleans up connected lines
lines = mlab.pipeline.stripper(src)

# Finally, display the set of lines
mlab.pipeline.surface(lines, colormap='Accent', line_width=1, opacity=.4)

# And choose a nice view
mlab.view(33.6, 106, 5.5, [0, 0, .05])
mlab.roll(125)
mlab.show()