Mri example
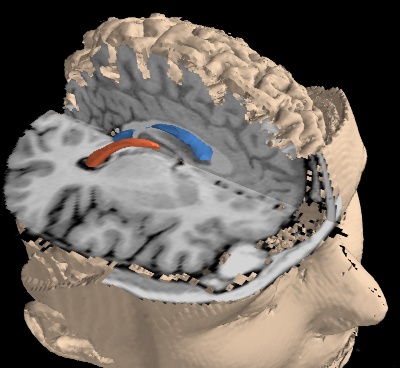
Viewing MRI data with cut plane and iso surface.
This example downloads an MRI scan, turns it into a 3D numpy array and visualizes it.
First we extract some internal structures of the brain by defining a volume of interest around them, and using iso surfaces.
Then we display two cut planes to show the raw MRI data itself.
Finally we display the outer surface, but we restrict it to volume of interest to leave a cut for the cut planes.
For an example of feature extraction from MRI data using Mayavi and vtk, see Tvtk segmentation example.

Python source code: mri.py
### Download the data, if not already on disk #################################
import os
if not os.path.exists('MRbrain.tar.gz'):
    # Download the data
    try:
        from urllib import urlopen
    except ImportError:
        from urllib.request import urlopen
    print("Downloading data, Please Wait (7.8MB)")
    opener = urlopen(
                'http://graphics.stanford.edu/data/voldata/MRbrain.tar.gz')
    open('MRbrain.tar.gz', 'wb').write(opener.read())

# Extract the data
import tarfile
tar_file = tarfile.open('MRbrain.tar.gz')
try:
    os.mkdir('mri_data')
except:
    pass
tar_file.extractall('mri_data')
tar_file.close()


### Read the data in a numpy 3D array #########################################
import numpy as np
data = np.array([np.fromfile(os.path.join('mri_data', 'MRbrain.%i' % i),
                                        dtype='>u2') for i in range(1, 110)])
data.shape = (109, 256, 256)
data = data.T

# Display the data ############################################################
from mayavi import mlab

mlab.figure(bgcolor=(0, 0, 0), size=(400, 400))

src = mlab.pipeline.scalar_field(data)
# Our data is not equally spaced in all directions:
src.spacing = [1, 1, 1.5]
src.update_image_data = True


# Extract some inner structures: the ventricles and the inter-hemisphere
# fibers. We define a volume of interest (VOI) that restricts the
# iso-surfaces to the inner of the brain. We do this with the ExtractGrid
# filter.
blur = mlab.pipeline.user_defined(src, filter='ImageGaussianSmooth')
voi = mlab.pipeline.extract_grid(blur)
voi.trait_set(x_min=125, x_max=193, y_min=92, y_max=125, z_min=34, z_max=75)

mlab.pipeline.iso_surface(voi, contours=[1610, 2480], colormap='Spectral')

# Add two cut planes to show the raw MRI data. We use a threshold filter
# to remove cut the planes outside the brain.
thr = mlab.pipeline.threshold(src, low=1120)
cut_plane = mlab.pipeline.scalar_cut_plane(thr,
                                plane_orientation='y_axes',
                                colormap='black-white',
                                vmin=1400,
                                vmax=2600)
cut_plane.implicit_plane.origin = (136, 111.5, 82)
cut_plane.implicit_plane.widget.enabled = False

cut_plane2 = mlab.pipeline.scalar_cut_plane(thr,
                                plane_orientation='z_axes',
                                colormap='black-white',
                                vmin=1400,
                                vmax=2600)
cut_plane2.implicit_plane.origin = (136, 111.5, 82)
cut_plane2.implicit_plane.widget.enabled = False

# Extract two views of the outside surface. We need to define VOIs in
# order to leave out a cut in the head.
voi2 = mlab.pipeline.extract_grid(src)
voi2.trait_set(y_min=112)
outer = mlab.pipeline.iso_surface(voi2, contours=[1776, ],
                                        color=(0.8, 0.7, 0.6))

voi3 = mlab.pipeline.extract_grid(src)
voi3.trait_set(y_max=112, z_max=53)
outer3 = mlab.pipeline.iso_surface(voi3, contours=[1776, ],
                                         color=(0.8, 0.7, 0.6))


mlab.view(-125, 54, 326, (145.5, 138, 66.5))
mlab.roll(-175)

mlab.show()

import shutil
shutil.rmtree('mri_data')
