Data Import Tool Overview
The Canopy Data Import Tool allows you to import and manipulate text data files in an easy and reproducible way. It is built on top of Pandas, providing an exploratory and graphical interface to data manipulation. After you have manipulated the data, you can take control of the underlying DataFrame from the IPython console in the Canopy Editor. You can also export your command history as a Python script so that you or any of your colleagues can perform the same set of manipulations and reproduce your results.
Apart from these docs, you can read more about the Canopy Data Import Tool, look up known issues, and provide feedback through the Enthought Knowledge Base. You can also write to us at canopy.support@enthought.com if you would like to provide feedback or report a bug.
Benefits of the Data Import Tool
- Easily import your data from structured text files, URLs containing embedded tables, or from your clipboard
- View and manipulate data in the Pandas DataFrame while simultaneously capturing the corresponding Python code
- Create re-usable recipes for common data munging tasks to expedite future data cleanup
For a quick demo of the Data Import Tool, please see the video Enthought Canopy Data Import Tool: CSV & More to Python Pandas DataFrames.
Reduce time spent on data analysis
Whether you are a data scientist, a quantitative analyst, an engineer, or evaluating consumer purchase behavior, stock portfolios, or design simulation results, your data analysis workflow probably looks a lot like this:
Acquire -> Wrangle -> Analyze and Model -> Share and Refine -> Publish
The problem is that often 50 to 80 percent of time is spent wading through the tedium of the first two steps – acquiring and wrangling data – before even getting to the real work of analysis and insight.
The Canopy Data Import Tool can significantly reduce the time you spend on data analysis “dirty work,” by helping you:
- Load various data file types and URLs containing embedded tables into Pandas DataFrames
- Perform data munging tasks that improve raw data
- Handle complicated or messy data
- Extend the work done with the tool, to other data files
For a detailed tutorial on speeding up common data analysis workflows with the Canopy Data Import Tool, please see the Webinar Fast Forward Through Data Munging with Python Data Import and Manipulation Tool.
Launching
There are multiple ways to launch the Data Import Tool:
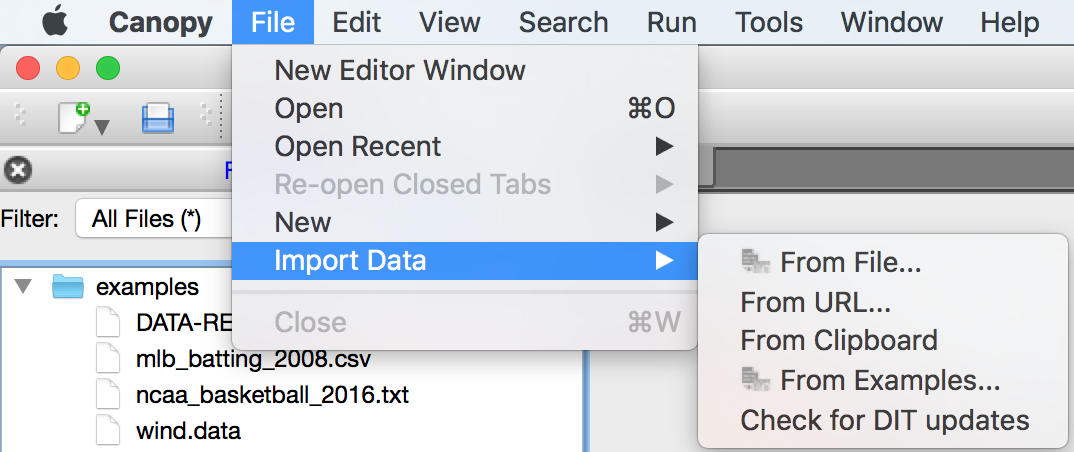
From the Canopy Editor, click File –> Import Data and select the data source you’d like to use – a file, a URL, or the clipboard
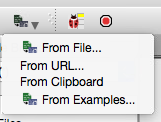
From the Canopy Editor Toolbar icon, click and select the data source you’d like to use – a file, a URL, or the clipboard
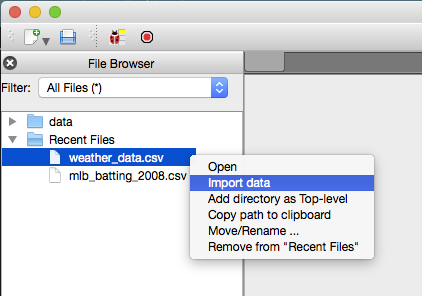
Right-click data files in the File Browser and select Import Data
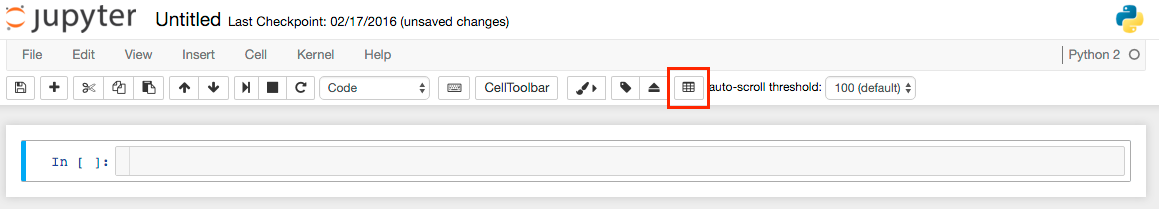
From within a Jupyter Notebook, click the Data Import Tool icon in the tool bar.
Note
The Data Import Tool will warn you if you are trying to open a file larger than 70MB in size. While the Tool can open the file and manipulate it, it can be time consuming. At the moment, we suggest you create a smaller data file with a subset of the original data for a more responsive preview.
Quick Start Example
Now that you know how to launch the tool, continue reading for more details about the interface or jump right into the example use cases with MLB batting data and Wind data to see how various commands can be applied and the results they produce.
Interface
The interface consists of five main components (see Figure: Main Interface):
- The Main View has three tabs. The DataFrame View is used to view and manipulate the data. The Raw Data View is a read-only view used to see the raw data being imported. Finally, the Python Code View is used to view the generated Python code representing manipulations.
- The Command History lists the manipulations you’ve performed. Click on a command to select it.
- The Command Editor is used to edit the currently selected command.
- The Configuration Pane can be used to change the name of the resulting DataFrame. This pane is hidden by default but can be toggled on/off via the View menu.
- The Log View Pane provides detailed messages regarding actions the tool is taking as you try out various commands, such as alerting you that a column’s data type was converted or if the tool detected a header line. This pane is hidden by default but can be toggled on/off via the View menu.
For more information about the various components, see Data Import Tool Interface.
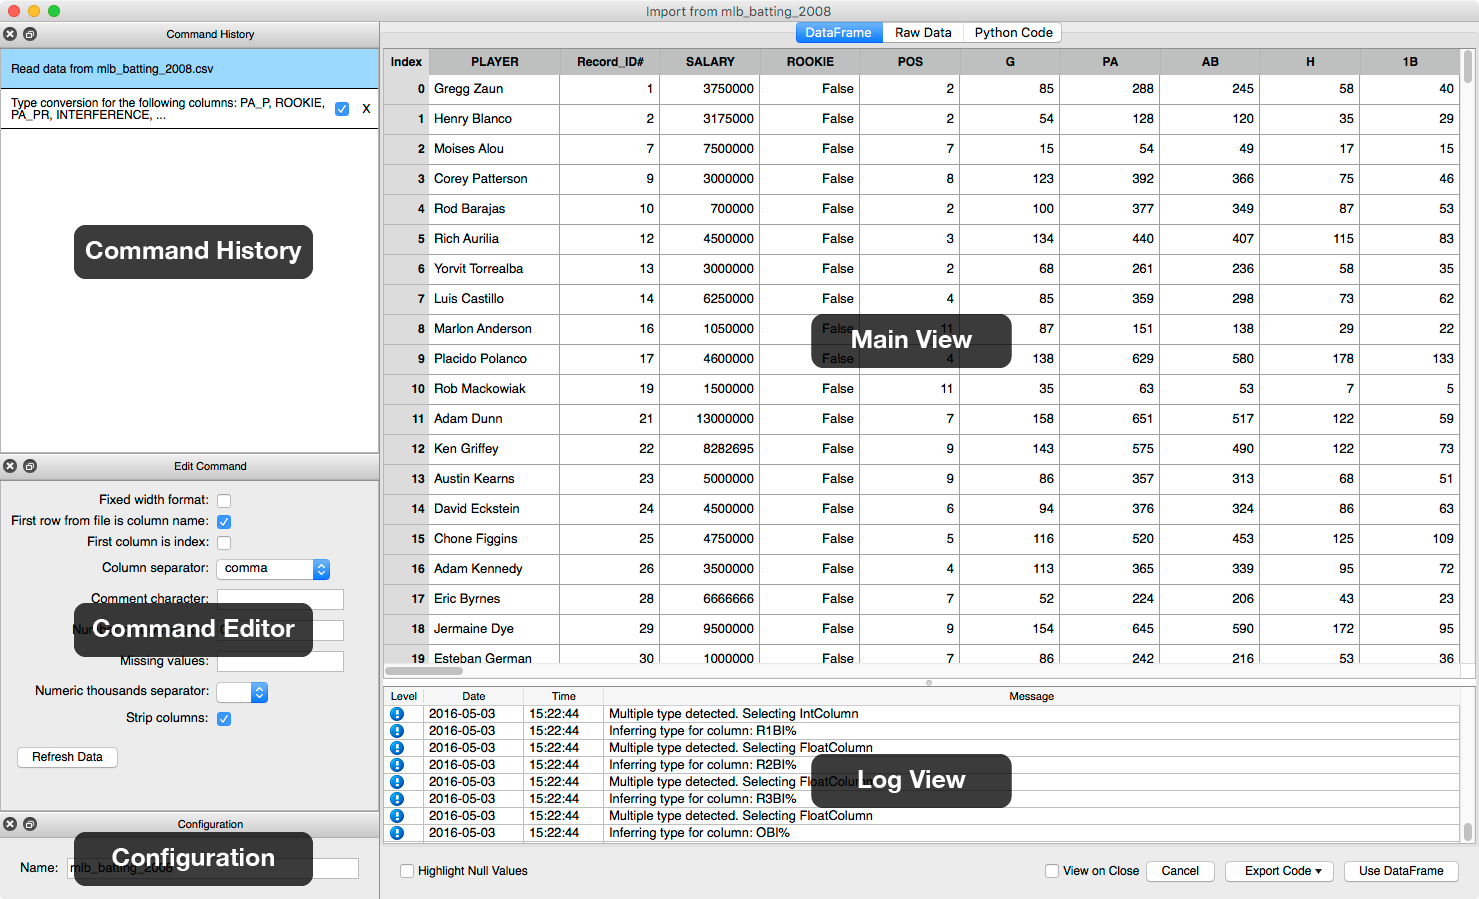
Figure: Main Interface
Commands
A command refers to a single data manipulation task – from renaming a column to deleting rows based on a condition. Every command is completely reversible, so don’t be afraid to try them! As commands are executed they are logged in the command history. This allows you to see the exact steps that have been taken while you transform your data. Commands in the command history can be enabled, disabled, or removed. These operations can be done to a command at any point in the history, and the other commands in the history will be reverted and re- executed accordingly to ensure that all commands are performed correctly.
Type Inference
The tool performs type inference on all the columns in your DataFrame. The current type of each column can be seen in a tooltip box when hovering over the column header. Additionally, columns can be converted to many other types. See Convert Column for more information on how.
Note
For data files with more than 250 columns, the Tool doesn’t perform automatic type inference and conversion. In this case, the user is expected to manually convert the columns to the type they wish by using the Convert Column command on their column of choice.
Accessing the DataFrame
When you are finished manipulating your data, you can click Use DataFrame
to inject the DataFrame into your Canopy IPython namespace. The name of the
DataFrame is set automatically to the filename, which you can change in the
Configuration Pane. Once you are back in Canopy’s IPython console,
you should have access to the view function that can be called with the
DataFrame as the argument. This will launch our viewer for easily seeing the
full data set. Clicking on the View on Close checkbox will also launch our
viewer after you load the DataFrame into the IPython console.
Exporting your commands to a script
At any point in the process of manipulating the DataFrame, the user can save the executed commands to a Python script with Export Code –> To Pandas Script.
Note
After the user clicks on Use Dataframe, the Data Import Tool automatically
saves the commands to a Python script. By default, the scripts are saved in
the data_import_tool/autosaved_scripts directory in your home directory.
You can change this default location in the Data Import Tool Preferences pane. The
Preferences pane can be accessed from the Data Import Tool Menu bar. This location will
also be visible from the Canopy File Browser.
Saving your DataFrame
The Tool allows you to save the DataFrame in multiple formats, accessed through Save –> Save DataFrame –> CSV/Excel File.
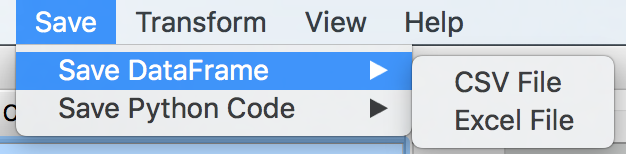
Figure: Saving the DataFrame
Saving your Command History
After a successful import, the Tool also saves the commands from your
Command History to a file, unique to each data source.
When you load the data source again, the Tool will automatically detect the
saved file containing a set of commands and applies them on top of the original
data frame. This way, you can start where you left off. The Tool also
loads the saved command history when loading data from similarly named files
or URLs. For example, commands performed and saved on a data file
mlb_batting_2008.csv will be automatically applied when the file
mlb_batting_2009.csv is loaded.