Working with Wind Speed Data
In this example, we’ll walk through some common commands that you might use when manipulating your data file:
- Join multiple columns together.
- Insert a new column, created using values from one or more existing columns.
- Delete rows based on a condition applied to a column’s values.
The Data Set
Here’s the data used in this example:
wind.data
See the relevant section from the file’s description below:
wind   daily average wind speeds for 1961-1978 at 12 synoptic meteorological
       stations in the Republic of Ireland (Haslett and Raftery 1989).

These data were analyzed in detail in the following article:
   Haslett, J. and Raftery, A. E. (1989). Space-time Modelling with
   Long-memory Dependence: Assessing Ireland's Wind Power Resource
   (with Discussion). Applied Statistics 38, 1-50.

Each line corresponds to one day of data in the following format:
year, month, day, average wind speed at each of the stations in the order given
in Fig.4 of Haslett and Raftery :
 RPT, VAL, ROS, KIL, SHA, BIR, DUB, CLA, MUL, CLO, BEL, MAL

The data are in knots, not in m/s.
Step 1: Opening the Data Set
The Data Import Tool can be used to open a data file in the following ways:
- From the Canopy Editor, by clicking on the File –> Import Data Menu Option and selecting the datasource you’d like to use – a file, a URL, or the clipboard
- Right-clicking on the data file in the File Browser and selecting Import Data
Note
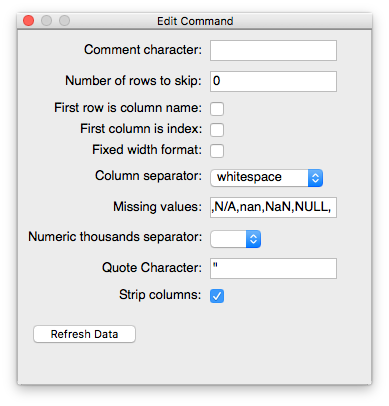
There is a small bug in the auto-detection for the wind.data file. While
the file is fixed width and the tool recognizes it as such, the second column
representing the numerical month is split incorrectly for two-digit months.
Select the first command in the history (initial Read command), deselect the fixed width check box in the Edit Command pane, and hit Refresh Data.
Step 2: Convert Year by Inserting Column
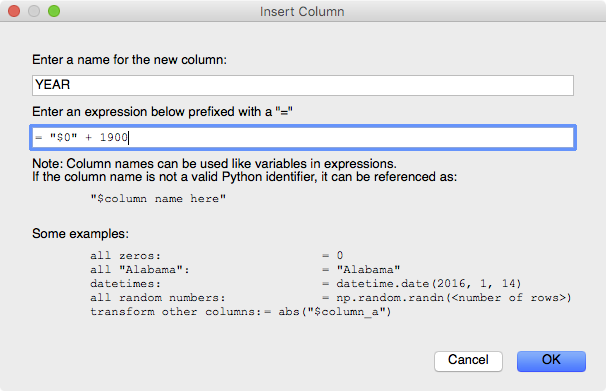
The first three columns denote the year, month,and day respectively. We’d like
to eventually end up with a column with a datetime datatype. To do this, we can
insert a column that converts the two-digit year into a four-digit version
before performing a join on the necessary columns.
The Insert Column command can be accessed from the Transform Menu or by right-clicking on a column header. Right-click on column “O”, select Insert Column and enter the following:
Delete the old year column (“O”) by right-clicking the column header and selecting Delete.
Step 3: Join Columns to Create Datetime Column
Now that we have our four-digit year, we would like to create a new column containing all three date values separated by a ‘,’, representing the complete date string:
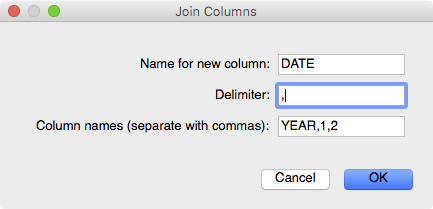
You’ll notice that once this new column was created the tool recognized this as
a date and subsequently converted the column’s datatype to datetime. Feel
free to delete the original year, month, and day columns.
Step 4: Renaming Wind Site Columns
The remaining columns represent the wind speeds recorded at various location in knots. First, we’d like to rename these columns to reflect their site name. By right-clicking each of the columns in turn, replace the name with the names provided in the description file:
RPT, VAL, ROS, KIL, SHA, BIR, DUB, CLA, MUL, CLO, BEL, MAL
Step 5: Insert Column with Converted Wind Speed
We would like to create a new column containing the wind speed information in meters per second for the RPT station:

Step 6: Remove Rows Based on Wind Speed
In this specific case, we would like to look at wind speeds recorded at greater than 34 Knots, considered gale wind speeds in the Beaufort Force Wind Scale. The Delete Rows Where command can be accessed from the Transform Menu:
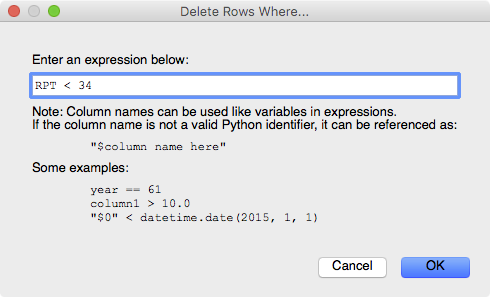
Note this removes a lot of our initial data and so this step is mostly for illustrative purposes on how to filter your data. In this case, the user would most likely click “Use DataFrame” to import the full data set into Canopy and then analyze further.