Visualization can be created in mlab by a set of functions operating on
numpy arrays.
The mlab plotting functions take numpy arrays as input, describing the
x, y, and z coordinates of the data. They build full-blown
visualizations: they create the data source, filters if necessary, and
add the visualization modules. Their behavior, and thus the visualization
created, can be fine-tuned through keyword arguments, similarly to pylab.
In addition, they all return the visualization module created, thus
visualization can also be modified by changing the attributes of this
module.
Note
In this section, we only list the different functions. Each function
is described in detail in the MLab reference, at the end of
the user guide, with figures and examples. Please follow the links.
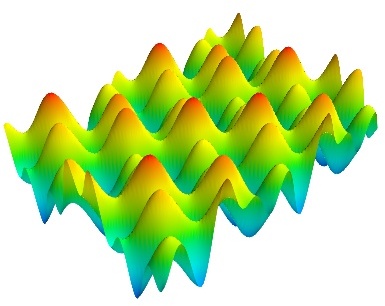
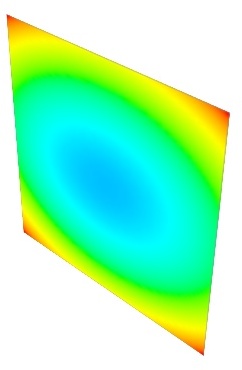
surf()
View a 2D array as a carpet plot, with the z axis
representation through elevation the value of the
array points.
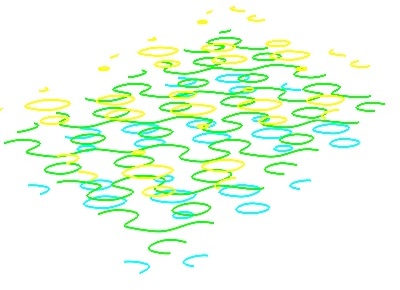
contour_surf()
View a 2D array as line contours, elevated
according to the value of the array points.
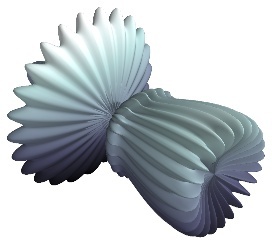
mesh()
Plot a surface described by three 2D arrays, x,
y, z giving the coordinates of the data points
as a grid.
Unlike surf(), the surface is defined by its
x, y and z coordinates with no privileged
direction. More complex surfaces can be created.
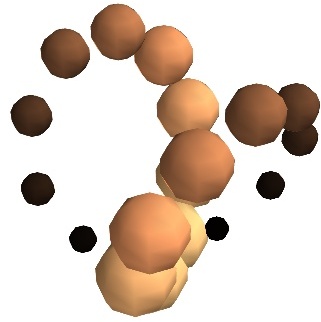
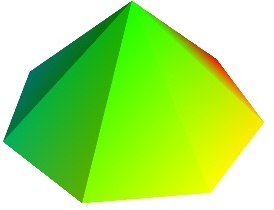
barchart()
Plot an array s, or a set of points with
explicit coordinates arrays, x, y and z,
as a bar chart, eg for histograms.
This function is very versatile and will accept 2D or
3D arrays, but also clouds of points, to position the
bars.
triangular_mesh()
Plot a triangular mesh, fully specified by
x, y and z coordinates of its
vertices, and the (n, 3) array of the indices of
the triangles.
contour3d()
Plot iso-surfaces of volumetric data defined as a 3D
array.
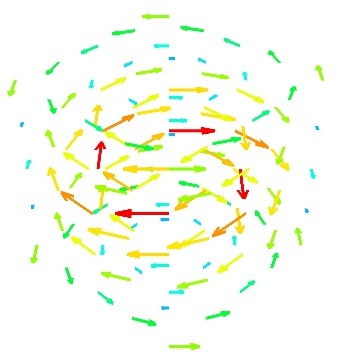
quiver3d()
Plot arrows to represent vectors at data points.
The x, y, z position are specified by
numpy arrays, as well as the u, v, w
components of the vectors.
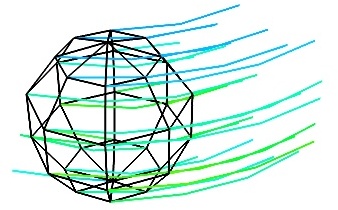
flow()
Plot a trajectory of particles along a vector field
described by three 3D arrays giving the u,
v, w components on a grid.
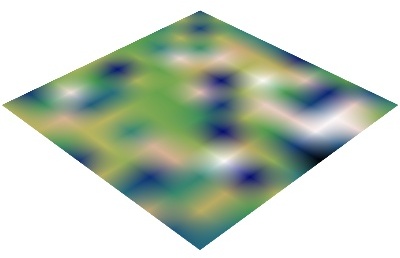
volume_slice()
Plots an interactive image plane sliced through
volumetric data.