Working with Demography of the United Kingdom data
In this use case, we will see how to load a table from a URL, and choose between multiple tables that might be present at the URL. Once we successfully load the table into the Data Import Tool, we will proceed to look at how we can change the index of the generated Data Frame. Finally, we will take a peek at the Python-Pandas code generated by the Tool, which we can use to replicate our work.
The Data Set
The data used here comes from the wiki page Demography of the United Kingdom. From this URL/dataset, we are interested in the 5th table, on Vital Statistics since 1960. On visual inspection of the table, it is obvious that the first column contains years. But, the column name field is empty, which will prompt the Data Import Tool to assign a default column name Unnamed: 0.
Columns from table:
(Year)
Average population (in thousands)
Live births
Deaths
Natural change
Crude birth rate (per 1,000)
Crude death rate (per 1,000)
Natural change (per 1,000)
Fertility rates
Population density
Step 1 : Opening the Data Set
See Launching the Data Import Tool to understand how to pass a URL to the Data Import Tool, from which we can load a table. The Data Import Tool, by default, opens the very first table on the wiki page. Instead, let’s say we are interested in the 5th table.
Step 2 : Choosing a table
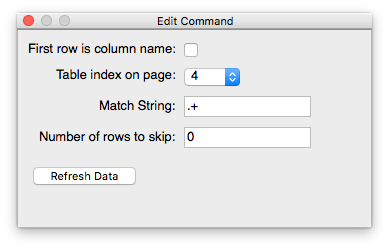
In order to load the the 5th table on the page, we can change the value of the Table index on page to 4 and click Refresh Data (Note that counting starts from zero.)
We can also see that the first row in the table seems to contain Column Names. By checking the First row is column name checkbox and clicking on Refresh Data, we can reload the dataset with the Column Headers. We also have the option to use the Promote Row to Header command to perform the same operation.
Refer to Read Data Command for more information on the initial read-in.
Step 3 : Renaming a Column Header and Setting the Index Column
Given the form of the data, it would be nice to use the 0th column, containing
years, as the Index of the DataFrame. It is currently named Unnamed: 0
because the Tool autonames columns if nothing is specified. We can now
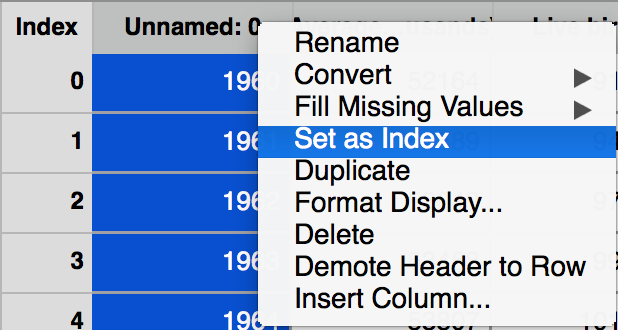
rename the column header by right-clicking on the column header and selecting
the Rename option.
We can set any column as the Index of the Data Frame by right clicking on the column name and clicking the Set as Index option. For more, see Setting Index.
Step 4 : Exporting generated Python Code
The Data Import Tool aims to provide a reproducible way of manipulating data sets. Towards this goal, the Tool generates Python-Pandas code that we can use to reproduce all of the operations we performs on a file. See Exporting your commands to a script for more information on exporting the generated Python script. In this particular case, the generated code is :
# -*- coding: utf-8 -*-

import pandas as pd

# Pandas version check
from pkg_resources import parse_version
if parse_version(pd.__version__) != parse_version(u'0.18.1'):
    raise RuntimeError('Invalid pandas version')

from catalyst.pandas.headers import get_clean_names
import re

# Read HTML from Demography_of_the_United_Kingdom
url= 'https://en.wikipedia.org/wiki/Demography_of_the_United_Kingdom'
data_frame = pd.read_html(url, header=0, skiprows=0,
                          match='.+', attrs=re.compile('wikitable'))[4]

# Ensure stripping and uniqueness of column names
data_frame.columns = get_clean_names(data_frame.columns)

# Set Unnamed: 0 as the table index
data_frame.set_index(u'Unnamed: 0', inplace=True)
As we can see from the generated code, pandas.read_html generates a list
of tables from the URL, from which we chose the [4] th table.
The additional parameter header=0 tells pandas to use the 0 th row in
the table as column names.
Secondly, the call to data_frame.set_index sets the column Unnamed: 0
to be the Index of the DataFrame.