Mlab visual example
A very simple example to show how you can use TVTK’s visual module with mlab and create simple animations.
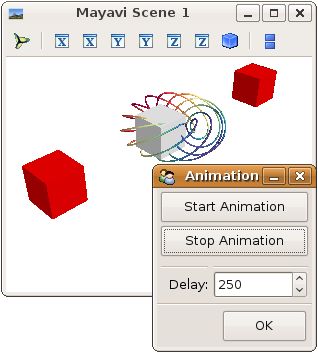
In the example, the grey box bounces back and forth between the two red ones.
The tvtk.tools.visual module exposes an API similar to VPython and is useful to create animation based on rigid object movement.
The @animate decorator ( mayavi.mlab.animate() ) is
detailed on section Animating a visualization.
If you want to modify the data plotted by the mlab (as in the mlab.test_plot3d() call) to create an animation, please see section Animating the data.
Python source code: mlab_visual.py
# Author: Prabhu Ramachandran <prabhu [at] aero.iitb.ac.in>
# Copyright (c) 2009, Enthought, Inc.
# License: BSD Style.

from mayavi import mlab
from tvtk.tools import visual
# Create a figure
f = mlab.figure(size=(500,500))
# Tell visual to use this as the viewer.
visual.set_viewer(f)

# A silly visualization.
mlab.test_plot3d()

# Even sillier animation.
b1 = visual.box()
b2 = visual.box(x=4., color=visual.color.red)
b3 = visual.box(x=-4, color=visual.color.red)
b1.v = 5.0

@mlab.show
@mlab.animate(delay=250)
def anim():
    """Animate the b1 box."""
    while 1:
        b1.x = b1.x + b1.v*0.1
        if b1.x > 2.5 or b1.x < -2.5:
            b1.v = -b1.v
        yield

# Run the animation.
anim()