Canopy Debugger and Variable Browser
Canopy includes a graphical debugger for Python programs. Using the debugger, you can run a script, pause its execution at specified breakpoints, and step through the code line by line. Whenever the program is paused, you can inspect variables and evaluate arbitrary expressions. Canopy’s debugger is tightly integrated with IPython’s debugger.
Canopy’s Variable Browser is also useful for inspecting variables defined in Canopy’s IPython pane, even when you are not debugging.
Debugger Availability
The Canopy debugger is available to paid and academic Canopy subscribers who have logged into Canopy on the Welcome Screen. To authenticate your debugger access initially, you may need to log in again or restart Canopy while net-connected. If you subsequently go offline, you can continue using the debugger.
Institutional subscribers who are permanently disconnected from the net, please contact Enthought Support at canopy.support@enthought.com for authentication instructions.
Debugger Actions
A typical debugging workflow begins with the following actions:
Toolbar
- Show/Hide Debug Panes: Show/hide all three debug panes (variable browser, stack browser, and breakpoint viewer, described below). This allows quickly switching in/out of debugging mode. The panes can also be toggled individually in the Canopy View menu.
- Auto Debug: Enable/disable auto debug mode. In this mode, any Python command that you execute in Canopy’s Python pane will be run under the debugger, honoring your breakpoints. A typical use for this would be debugging a function by calling it in the Python pane, without needing to write a special test module just for the purpose of debugging.
- Debug File: Same as Debug File menu action, plus a dropdown menu which is the same as the Debug Configurations menu action.
Common Debugging Actions
The following additional actions are available via the Canopy menu bar and the debug toolbar when debugging a file.
- Stop Debugging: Stop debugging and terminate the debugged program. If the program is already paused in the debugger, this is straightforward. Otherwise, this action will attempt to interrupt the IPython kernel. If this does not succeed (for example if your program is stuck in a non-Python extension module), then you will need to restart the IPython kernel from the Canopy Run menu.
- Continue Execution: Continue executing the script if paused at a breakpoint or paused while stepping through code.
- Step Into: Execute the current line of code, then pause at the next executable line of Python code (stepping into functions called from the current line, if any).
- Step Over: Execute the current line of code, then pause at the next executable line of Python code in the current frame (not stepping into any function calls in the current line).
- Step Out: (Step Return) Continue execution of the current function until it is ready to return to its caller; then pause.
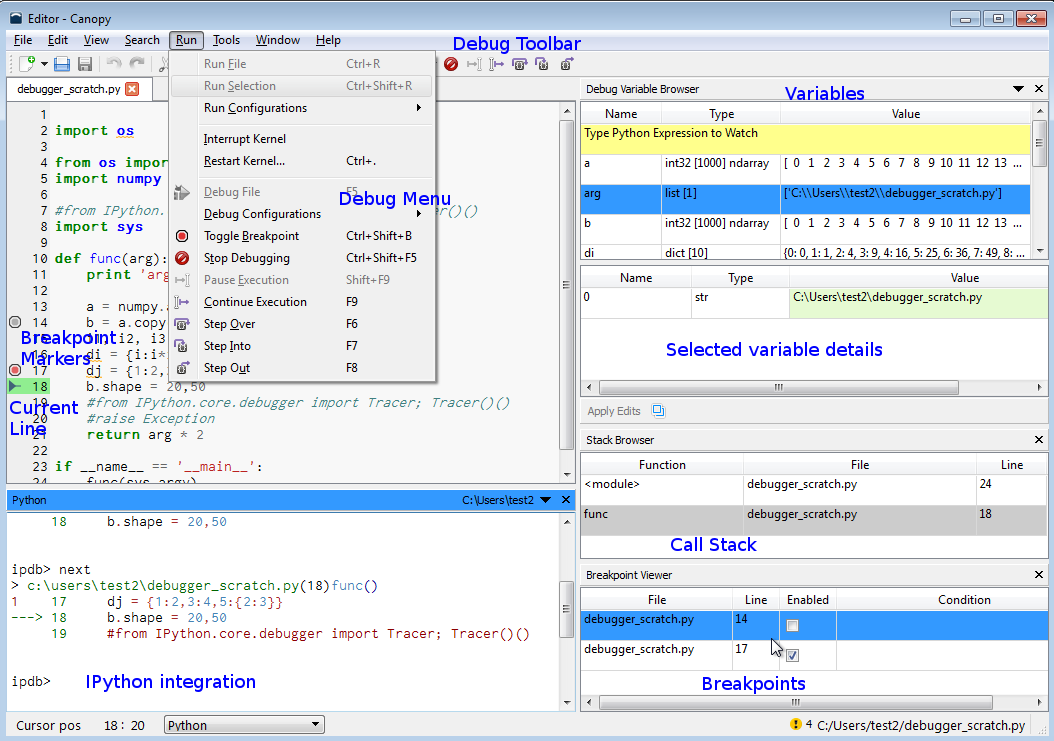
Breakpoints
Breakpoints are places in code where you want the running program to pause temporarily, so that you can understand what the program is actually doing, by verifying that it reaches that line of code, and inspecting its variables at that point in the program’s execution.
A breakpoint can be added at any line of code in a Python file by double-clicking the left margin, where the line number is shown in the code editor. A small “bug” marker is shown in the margin when the breakpoint is active.
The breakpoints in all files are also listed in the “Breakpoint Viewer” dock pane. From this pane, you can enable/disable breakpoints and optionally edit a breakpoint’s “condition” by clicking on its Condition cell. (A breakpoint with a condition is known as a “conditional breakpoint”. Execution only pauses on that line when the specified condition evaluates as true.)
Right-clicking a breakpoint lets you delete it. Double-clicking on a breakpoint in the breakpoint viewer takes you to the file/line where the breakpoint is defined.
Stack Browser
When a debugged program is paused at a breakpoint or paused when stepping through code, the “Stack Browser” dock pane shows the frame stack of the debugged program.
The first/oldest frame (for the file where you started the debugger) is shown at the top of the stack browser. The last/newest frame (for the deepest currently executing function) is shown at the bottom of the stack browser.
For these and each frame between them, the stack browser shows you the name of the paused function, the name of the file where it is defined, and the paused line number in that function. For the last/newest/bottom frame, that line will not yet have begun executing. For all older/higher frames, that line will be in mid-execution.
You can double-click on any frame to open the corresponding file in the code editor, with the cursor positioned at that line of code.
Variable Browser
When a debugged program is paused, the “Debug Variable Browser” dock pane shows the local variables in the frame that is currently selected in the Stack Browser.
The variable browser is split into two areas. The variable selected in the upper table is shown in more detail in the lower area.
Some types of values can be edited; currently, these are only objects having primitive types such as int, float, or str, and also primitively typed elements within lists, dicts, and arrays of 1 or 2 dimensions. If such a value is shown in green, then it can be edited directly in the variable browser. (Currently, some values that can also be edited are not shown in green.)
Apart from the variable browser, you can also view a string representation of variables when you hover the mouse over a variable name in the editor while debugging.
Watch Expressions
Watch expressions are Python code expressions which are always evaluated in the currently selected stack frame when the debugger is paused. They are shown in yellow at the top of the variable browser’s table of variables.
This is useful for tracking variables which are not local to the selected
frame, such as a global variable which you want to track no matter what your
current stack frame may be, or for more easily seeing local variables which
are located too far down the variable table to see conveniently. You can also
enter expressions such as len(my_list) to keep track of computed values
while debugging your code.
Watch expressions can be added by clicking the “Type Python Expression to Watch” cell (highlighted in yellow) in the variable browser, typing your expression, and pressing the “Enter” key. The expression is added as another row below.
You can edit the watch expression in place by clicking it, or delete it via its right-click menu.
Special Values
The variable browser also shows some special values when stepping through code.
- Function Parameters: When you step into a function, the parameters of the newly called function are listed, highlighted in light blue.
- Function Return Value: When you are about to exit a function by returning from it, the return value of the function is shown, highlighted in light purple.
- Exception: Whenever your code hits an unhandled exception, the type and value of the exception are shown, highlighted in light red.
Python Variable Browser
Even when you are not debugging, the variable browser pane is useful: it shows the variables which you defined in the Canopy Python pane, either directly or by running scripts. Variables predefined by IPython are not listed here, to reduce clutter. To indicate this change in behavior, the title of the pane is changed from “Debug Variable Browser” to “Python Variable Browser”.
In this mode, watch expressions are not used or evaluated, and just occupy screen space.
IPython Debugger Integration in the Canopy Python pane
The Canopy debugger integrates with the Python pane to provide command-line interactivity. At its core, the Canopy debugger is just an interface to IPython’s debugger, so while debugging you can use the Python pane just as you could interact with IPython’s debugger in a console. Note that readline completion is not available due to limitations of the IPython kernel and QtConsole.
The following IPython magic command can be used to start debugging a file in Canopy. (This is the same command that you could use to debug in standalone IPython):
%run -d <filename> <args>
If you want to start debugging with the Canopy debugger only when your program
execution reaches a certain line in your code (similar to the use of Python’s
pdb.set_trace()), you can use the IPython equivalent,
from IPython.core.debugger import Tracer; Tracer()(). When this line is
executed, the IPython/Canopy debugger will begin operating.
The following common commands are available when you are already
debugging a file within Canopy, and you can see the ipdb> prompt in
the Python pane. These commands interact with the Canopy debugger
interface when relevant.
- bt, w(here)
Show the traceback of the current execution state of the program.
- u(p) / d(own)
Move the current frame one level up/down in the stack trace (to an older/newer frame).
- s(tep) / n(ext) / r(eturn) / c(ont(inue))
Step into, step over, step out/return, or continue execution, respectively, while debugging, corresponding to these same actions in the Canopy debugger.
- p
p <expression> Evaluate an arbitrary expression in the currently active frame and print the result, similar to, but distinct from, the Canopy debugger’s Watch list.
- p
- pp
pp <expression> Same as p <expression> but pretty-print the result.
- pp
- !
! <statement> Execute a Python statement in the currently active frame.
- !
- b(reak)
Show/add/remove/modify breakpoints. Type help break for more details.
- help
help [topic] Show help on these and many other IPython debugging commands.
- help
Debugger FAQs, Known Issues, and Other Resources
Please see the Enthought Support Knowledge Base.