Working with Major League Baseball Batting Data
We’ll illustrate how to import a data file as a Pandas DataFrame into the IPython namespace using the Data Import Tool.
The Data Set
Here’s the data used in this example:
mlb_batting_2008.csv.
Step 1: Opening the Data Set
The Data Import Tool can be used to open a data file in the following ways:
- From the Canopy Editor, by clicking on the File –> Import Data Menu Option and selecting the datasource you’d like to use – a file, a URL, or the clipboard
- Right-clicking on the data file in the File Browser and selecting Import Data
After opening the file, you will be able to use the Data Import Tool to browse through the data:
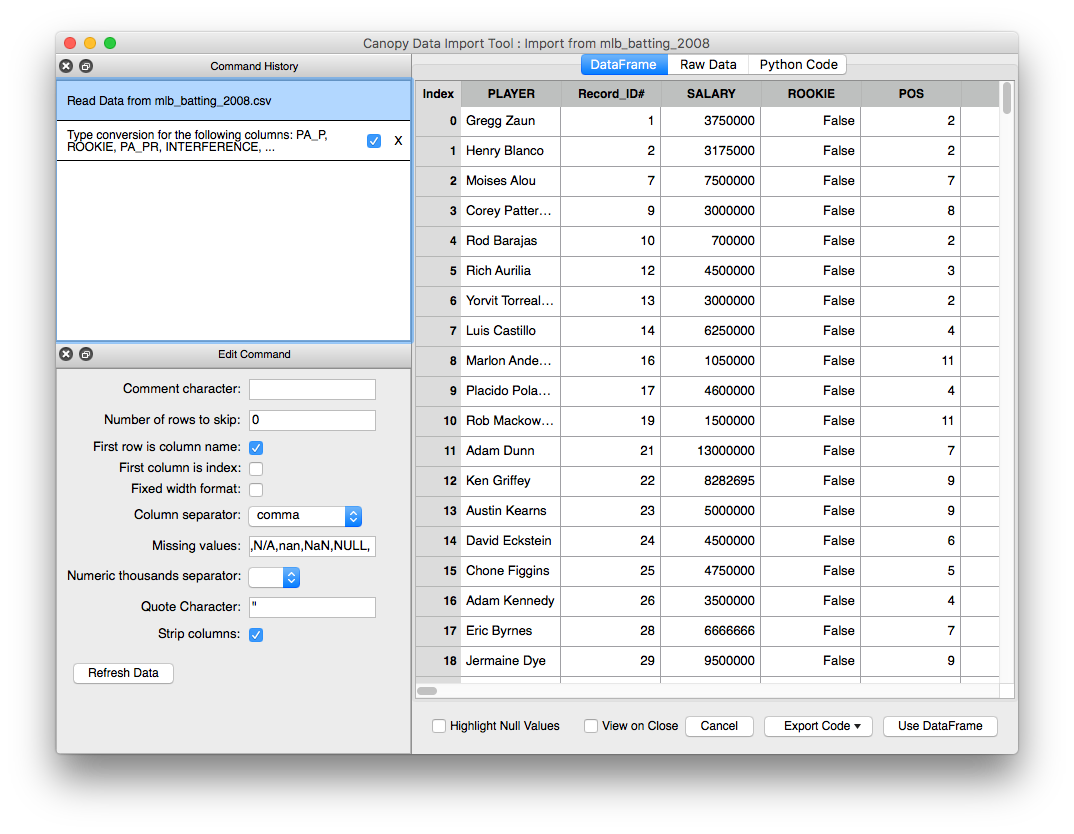
Figure : Data Import Tool Window
Step 2: Deleting Rows
To delete rows that contain records for rookie players, we can use the Delete Rows Where command, utilizing the ROOKIE column. Under the Transforms menu, select the appropriate command:
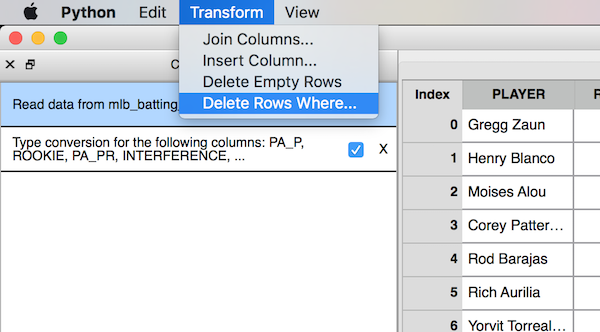
Figure : Transforms Menu
Then enter a boolean expression to filter the data:
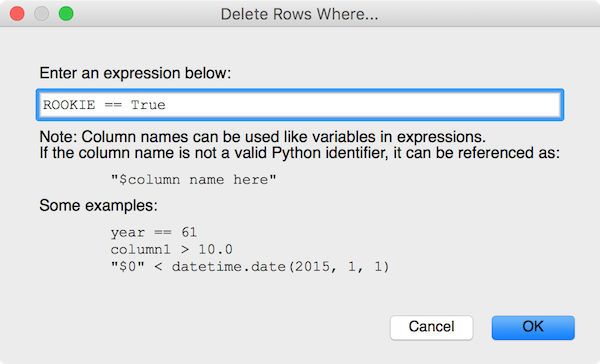
Figure : Delete Rows Where ROOKIE == True
Step 3: Loading the DataFrame into Canopy
Clicking on the Use DataFrame button at the bottom of the Data Import Tool will load the dataset as a Pandas DataFrame object into Canopy’s IPython namespace. The Data Import Tool automatically uses the name of the data file, minus the file extension, as the name of the resulting Pandas DataFrame. This can be changed in the Configuration Pane. The console will provide messages with some information regarding your recent import:
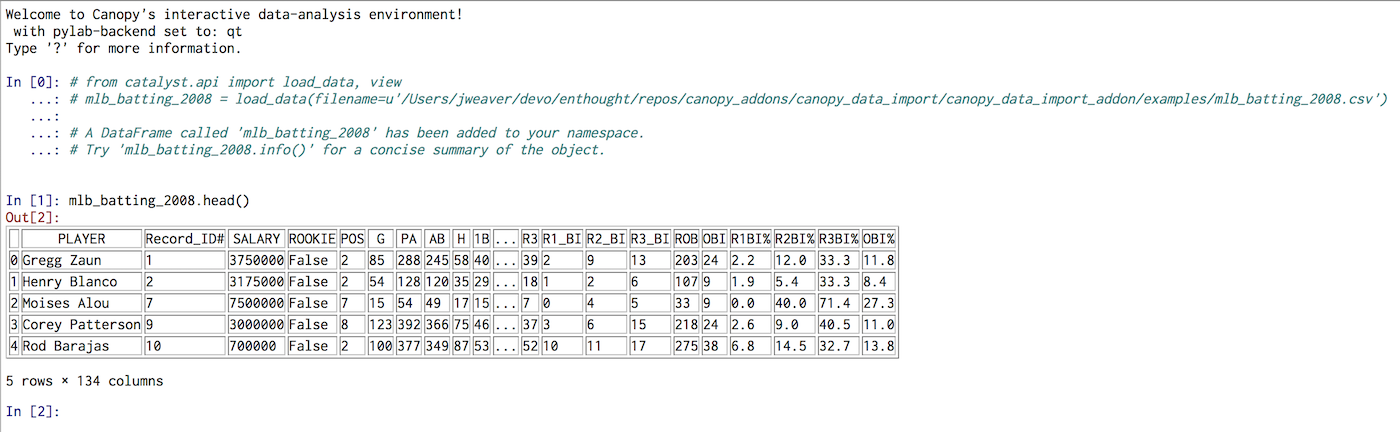
Figure : DataFrame Loaded into Canopy
We can now view the contents of Pandas DataFrame object from the IPython terminal and use it for further numerical analysis. A trivial exercise using the DataFrame, as shown below, would be to plot a histogram of the salaries of the players contained in the data set:
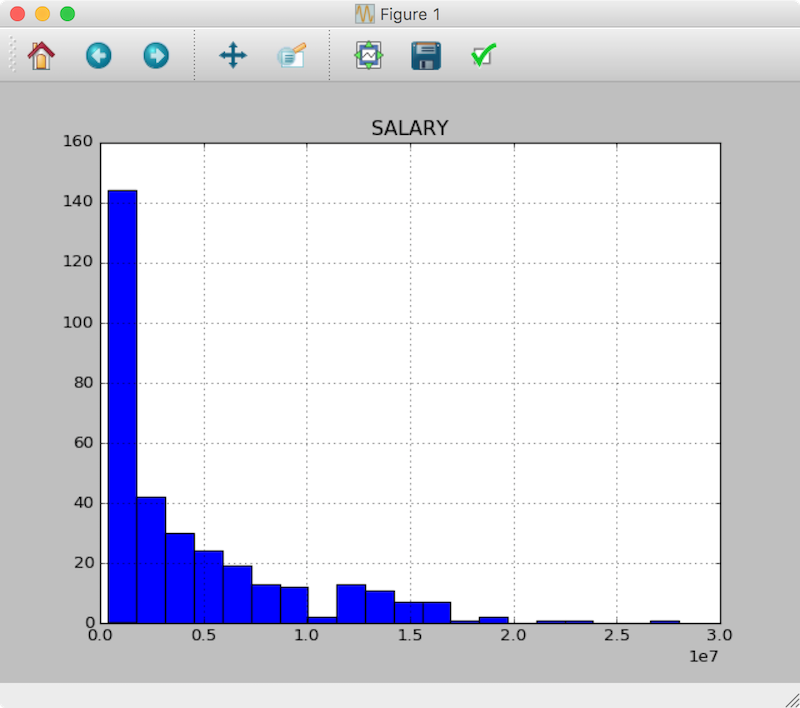
Figure : Histogram Plot