Application Overview
This application is intended to explore ideas for visually edit/run/debug data flow networks and explore the data generated by them.
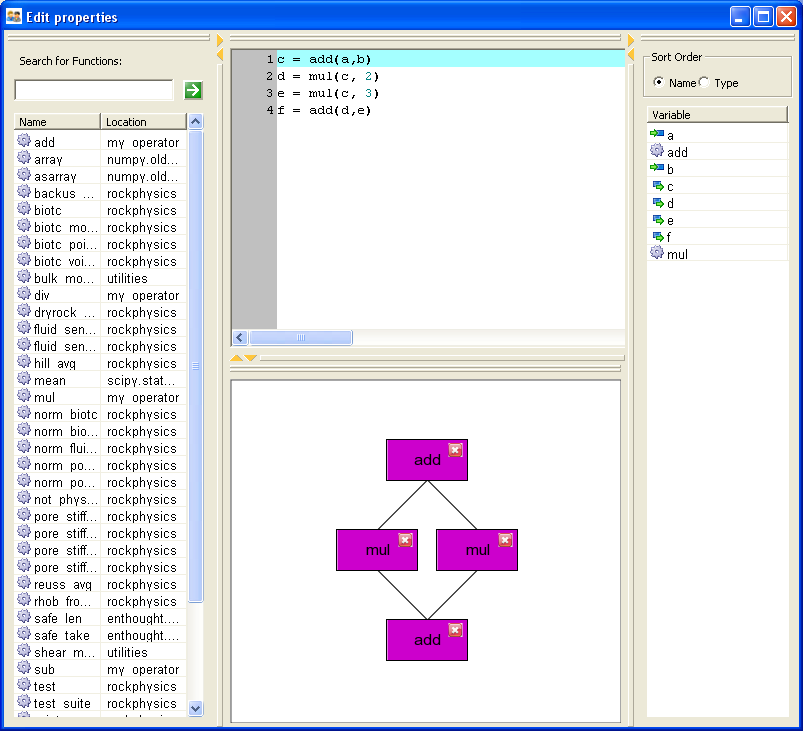
Users can see two (partially) synchronized views of the data flow. One is the actual python code that represents the data flow, and the other is a visual layout of the data flow on a canvas. The canvas is fairly simple in that it doesn’t show all the input/output ports of functions – it simply draws a single line between two related functions. This is a valuable view, but we will likely want to enhance it with a “port” view later. Users can move components around on the graph. They can select multiple items with Ctrl-click, and they can move multiple items as a group. They can also delete functions with the “Del” key. (The “close” icon in the corner of functions should also delete components, but buttons are working right now.)
If you edit the code view, the canvas will update (and through out any layout you may have done – bad). However, editing the workflow on the canvas does not synchronize to the code view – bad. Figuring out the correct underlying model for this is a major future task for us.
There are two additional widgets in the view. One is a search window that allows you to search through a list of functions. You can drag/drop functions from this window onto the canvas and that component is added. It names the inputs of the function the same name as they are declared in the function. The output is generically named “result”. This can be improved if we parse the function code looking for a return statement. For our rock physics libraries, this will work pretty well. Also, we can do better than this with has_units functions because their inputs and outputs are available as attributes on the function. If you add a function to the canvas, it is not added to the code as we do not have a code generator from blocks at the moment. This is not to hard to write, but it also may not be the desired model... (we’ll have to see).
The other widget shows the input/output/functions currently on the function. It will udpate as the canvas updates. You can sort by type or name. In the future, clicking on one of these should highlight the function blocks on the canvas that it pertains to. Also, the code view should indicate the lines it pertains to.
That is it so far. I would like to have function input/output editors, and a context viewer up and running fairly soon.
Architecture
This entire application centers around viewing/editing/debugging a graph representation of executable Python code and viewing/manipulating the input/ outut data to the graph. The “executable graph” is currently represented as a Block from enthought.numerical_modelling. It is a reasonable start, but may not suffice for editing graphs [to be determined]. The data part is likely to be a NumericContext item, but it should probably work (at least for execution if it is a lowly dictionary).
Our current application generally breaks up into 3 chunks of functionality that are bound together by the Display class in main.py. They are the 1) search widget (function_search.py, and function_search_ui.py, 2) variable display widget (block_variables_ui.py), and 3) The canvas which makes up the bulk of the application code (see below).
The other important class is the BlockGraphController which ties the canvas view to its underlying Block model. Users interact with the canvas, but the controller decides what to do with these individual actions. It also updates the view if the block changes underneath it. This class will likely need to get inputs from the block_variables_ui as well to highlight or “flash” blocks that are highlighted on the canvas. It will likely want to control the code window in the future as well.
Canvas Architecture
The basic building blocks for the canvas are the:
| Canvas Related Classes | Description |
|---|---|
| SelectionContainer | This is an enhanced Enable Container that can manage the selection of multiple components within it. This list of selections is managed by a SelectionManager object. Whenever this container gets events like “delete” or “move”, it hands off the actual work to a controller that decides a) what to do with the visualization and b) what to do with the underlying model. In our case, this is the BlockGraphController. |
| SelectioManager | Actually, this guy does most of the work for the SelectionContainer. |
| ISelectable | Interface required by the SelectionManager to deal with “Selectable” items on a canvas. |
| SelectableComponentMixin | Mixin that handles selecting and moving state tranisitions for items on the canvas. It handles this aspect for EnableBox. |
| EnableLine | connection lines between function boxes. The end points of the lines are connected to an input and an ouput function and the line is redrawn any time one of the function boxes is moved. |
| EnableImageButton | Button Component that changes button image on role-over and fires a clicked event. It doesn’t yet give visual feedback when clicked. This is currently only used as the CloseButton in the EnableFunctionBox. |
| CloseButton | Extends button to anchor it the top right corner of its container. Also resets the default icon to use the close icons. |
| EnableBox | Generic labeled box that participate in selection on a canvas. Something like this guy should go in a generic object canvas in Enable. |
| EnableFunctionBox | A specialized version of EnableBox for drawing functions on the canvas. It also adds the CloseButton to the function. |